Direct Payments Analysis 2022/23
NHS Digital publishes data collated from local authorities on direct payments (DPs) annually. Below are some key observations from the data published for the 2022/23 year.
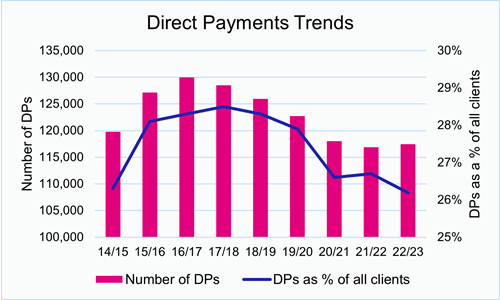
The reduction in direct payments has halted (kind of)
The total number of DPs in England is 117,465. This is a small increase on 2021/22, but still some way below the peak of 129,975 in 2016/17.
However, the picture is mixed: the proportion of people who access long-term support and who have a DP fell to 26.2% (2021/22: 26.7%), due to the total number of people accessing social care increasing at a faster rate.
Delving deeper into the data shows that the total spend on those 117,465 DPs was just over £2.0 billion in 2022/23, which is an average of £17,183 per annum per DP holder.
The gap in take-up by age group is widening
At an overall level, the number of people aged 18-64 receiving long-term social care support is roughly the same as those aged 65+. However, the younger group make up a much higher proportion of the direct payments as follows: 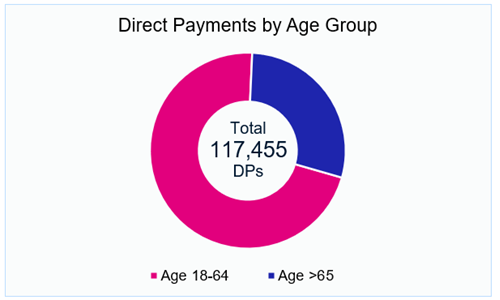
Over the 12 month period, the aged 18-64 group increased by 1,400 people and age 65+ group actually fell by 806 people. This was a trend that we identified in our analysis of the 2021/22 data and which is sadly continuing.
Given that the age 65+ group is likely to have a higher mortality rate, this suggests that 'new' direct payments are not coming through quickly enough to replace those that pass away.
Top (and bottom) of the table
We will caveat this section by saying that this isn't about calling out who is 'good' or 'bad', but trying to identify movement and trends.
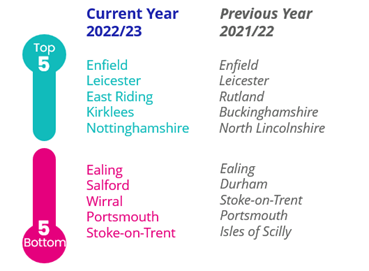
The disparity between the top LAs and the bottom LAs is stark: to be in the top 5 needs an uptake of 42.5% or more. Uptake of less than 11.5% puts you in the bottom 5 of the 151 LAs with social care responsibilities.
There was no movement in the top 2. However, East Riding jumped from 10th to 3rd place overall in 2022/23, largely because an impressive 83% of people aged 18-64 now have a DP in East Riding.
Some of the most significant movers in 2022/23 were:
- Kirklees rose from 22nd (37.1% uptake) to 4th (42.7%). The number of DPs actually fell by 192 over the 12 months, but so did the total number of people that the LA supported.
- Bromley moved up 47 places with a 7% increase in uptake.
- Other LAs on a notable upward trajectory include Newham, Plymouth, Solihull, South Gloucestershire, Haringey, and City of London.
- Wirral fell 32 places. DP uptake fell from 19.0% to 8.3% in just 12 months due to a twin-effect of the actual number of DPs falling and the total number of people supported by the LA increasing.
- Bracknell Forest fell 53 places, continuing a trend that has seen DP uptake fall from 46.8% in 2018/9 to 23.6% in 2022/23.
A tale of two London boroughs
In looking at the dashboard that the NHS publishes, two London boroughs caught our eye: Enfield and Ealing. At first glance, they seem very similar in terms of population, political control, deprivation levels and life expectancy measures, and are just 16 miles away from each other around the North Circular road. Yet they are ranked 1st and 147th nationally in terms of direct payment take-up:
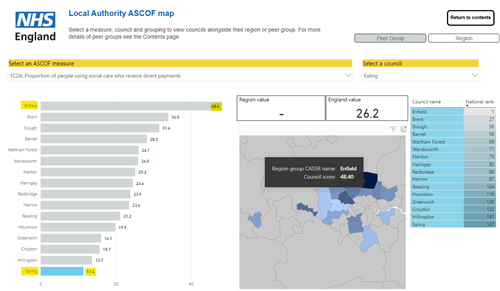
PPL doesn't have any relationship with, or insights in to, either of the two councils. We therefore won't speculate on the potential reasons for the difference in DP uptake, except to say that the sector generally should be sharing best practice to close gaps wherever possible.
Ethnicity insights
Roughly 26 in every 100 people that receive social care do so as a DP. However, the data indicates that certain ethic groups are more likely to have a DP:
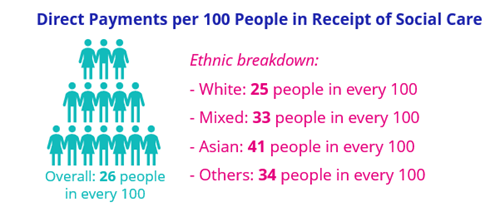
The data shows that gender doesn't make much difference to DP uptake overall, but our analysis does indicate that a female of Asian ethnicity is over 70% more likely to have a DP than a female of White ethnicity.
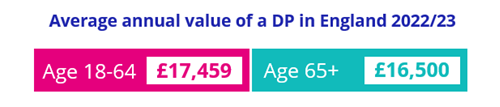
The average value of a DP
The ASCOF dataset draws upon data from the SALT returns. The SALT returns have much more detail - including the gross expenditure on DPs for each LA. Across England, LAs spent just over £2 billion on DPs in 2022/23, out of a total expenditure of £18.5 billion.
Based upon the number of DP holders, we are able to calculate the average spend per DP for each LA, at a regional level and at an overall level.
This is higher than we expected based upon our experiences and anecdotal comments about typical DP values. At a LA-level, there are some significant outliers, which does suggest that the data may not be entirely like-for-like. However, some of the safer insights that can be highlighted are:
- The average spend per DP across London is roughly 5% below the national average. We didn't expect that.
- For the age 18-64 group, the average spend per DP across each regional area are all clustered closely to the national average (the lowest is North East £15,760 per DP, the highest is Yorkshire & Humber £19,504 per DP).
- For the 65+ group, there is a much wider spread from the national average (the lowest is North East £12,375 per DP, the highest is East of England £21,053 per DP).
The above averages are all higher than we see through Virtual Wallet - for example, a sample of three LAs (each with 300+ DPs via Virtual Wallet) shows they have an average annual DP of £10,500, £13,364 and £16,991 respectively. It could be that those via Virtual Wallet are not representative of the bigger picture. Another explanation could be that the SALT definition of expenditure includes more than just the actual DP funds directly provided (service delivery costs, client contribution?). This is an area we will do more analysis on in the future.
Next steps
We now know our way around the data well. We can (definitely) help you ask the right questions, and (maybe) help you find some of the answers. If you want to chat informally about any of the above or what the data says about your LA, we'd be happy to hear from you.